Concentrated Solar Power Market Forecast 2025-2033: Navigating the Niche Within the Renewable Energy Boom
The global renewable energy market is poised to grow from USD 1,738.8 billion in 2025 to USD 5,698.6 billion by 2033 at a CAGR of 15.8%, while the concentrated solar power (CSP) segment—valued at USD 7.5 billion in 2025—is forecast to reach USD 17.3 billion by 2033 (CAGR 11.1%). This article provides a deep industry audit of CSP’s unique role, examining its technology segmentation (parabolic trough, power tower, etc.), applications beyond electricity (enhanced oil recovery, desalination), storage capabilities, and the supply chain and policy dynamics that differentiate it from faster-growing solar PV. Insights uncover hidden economic logic: CSP’s dispatchability and industrial heat potential make it a strategic complement to variable renewables, with cross-sector implications for water, oil, and grid stability.
Omar Hassan
Editorial Analyst
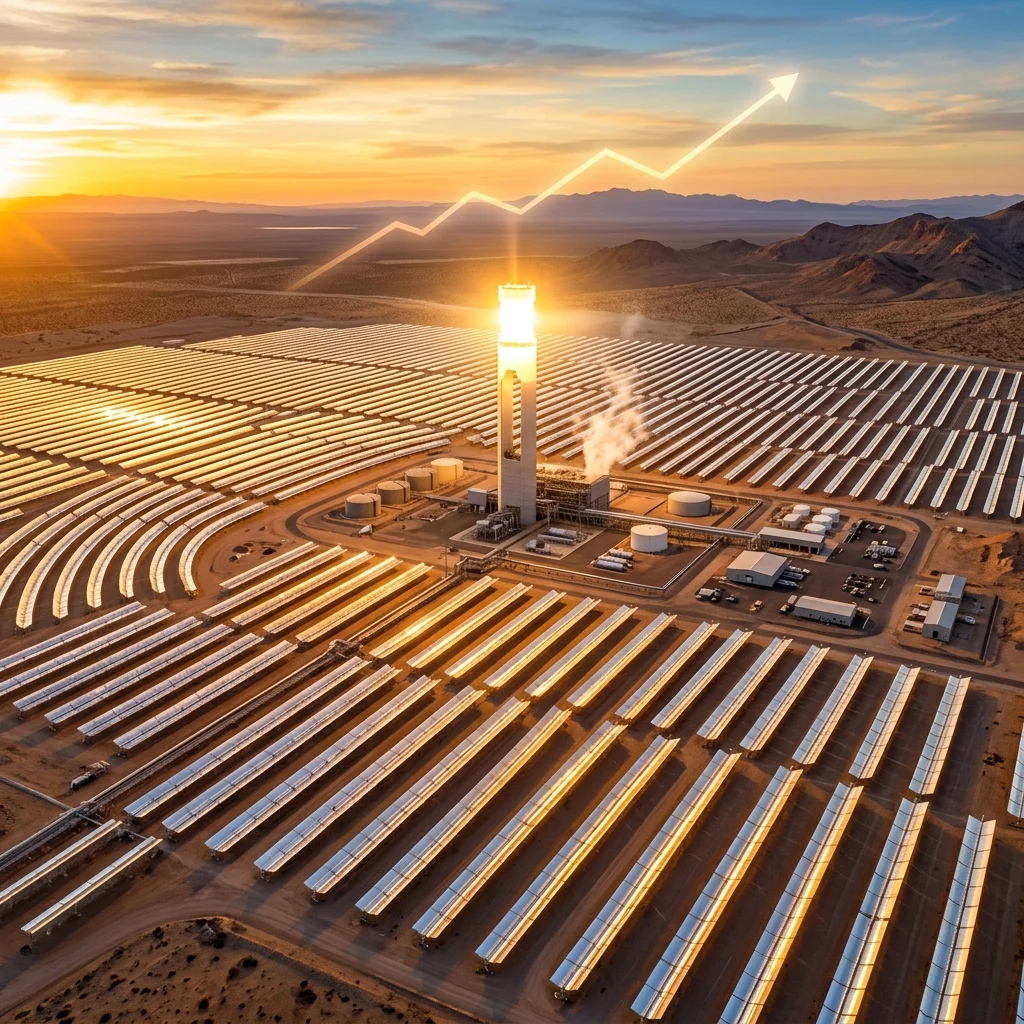
Concentrated Solar Power Market Forecast 2025-2033: Navigating the Niche Within the Renewable Energy Boom
Introduction: The Twin Growth Story
The global renewable energy market is expanding at a compound annual growth rate (CAGR) of 15.8%, projected to leap from USD 1,738.8 billion in 2025 to USD 5,698.6 billion by 2033. This explosive growth is overwhelmingly driven by solar photovoltaic (PV) and wind power, which benefit from steep cost declines and broad policy support. Yet within this boom, a slower but strategically vital segment—concentrated solar power (CSP)—is carving its own path. Valued at USD 7.5 billion in 2025, the CSP market is forecast to reach USD 17.3 billion by 2033, growing at a CAGR of 11.1%.
These numbers tell a twin story: one of volume and scale, the other of precision and resilience. CSP’s value does not lie in matching PV’s deployment velocity. Instead, it lies in dispatchability, industrial heat potential, and cross-sector applications—making it a hidden linchpin for the energy transition. This article provides a deep industry audit of CSP’s unique role, examining technology segmentation, applications beyond electricity, storage capabilities, and the supply chain and policy dynamics that differentiate it from faster-growing solar PV.
[IMAGE: Global map showing major CSP installations (e.g., US Southwest, Spain, Morocco, China) overlaid with renewable energy growth arrows.]
Macro Perspective: The Renewable Energy Boom and CSP’s Relative Position
The renewable energy sector’s 15.8% CAGR reflects aggressive deployment of solar PV and onshore/offshore wind, driven by falling levelized costs of energy (LCOE) and ambitious government targets. PV module prices have dropped over 90% in the past decade, making solar the cheapest electricity source in many regions. Wind power, both onshore and offshore, has similarly benefited from technology maturation and economies of scale.
CSP’s lower CAGR of 11.1% is not a sign of failure but a reflection of structural differences. CSP plants require higher capital costs, longer construction timelines—often 3–5 years—and depend on direct normal irradiance (DNI) levels found only in specific sunbelt regions. These factors limit CSP to a smaller addressable market.
However, absolute growth from USD 7.5 billion to 17.3 billion indicates sustained investment in niches where PV cannot compete. Two critical differentiators are: (1) CSP with integrated thermal energy storage (TES) can deliver dispatchable power for 6–15 hours after sunset, and (2) CSP can produce high-temperature heat (up to 1000°C in power towers) for industrial processes. These capabilities are increasingly valued as grids with high renewable penetration face evening demand peaks and industrial decarbonization pressures.
The implication is clear: CSP is not a laggard but a specialized play with a distinct risk-return profile for investors and grid planners. Its growth may be slower, but its contribution to reliability and sector coupling is irreplaceable.
[IMAGE: Comparative bar chart of renewable energy sub-segments growth rates (PV, wind, CSP) using the provided CAGR data.]
Deep Dive into CSP Segmentation: Technology, Capacity, and Operation
Technology: Parabolic Troughs vs. Power Towers
Parabolic trough technology currently dominates CSP installed capacity, accounting for over 80% of operating plants. These systems use curved mirrors to heat a heat transfer fluid (typically synthetic oil) to around 390°C, which then generates steam to drive a turbine. While mature and reliable, their operating temperatures limit efficiency.
Power tower (central receiver) systems are gaining share due to their ability to reach much higher temperatures (565°C with molten salt or even higher with air or particles). This translates to higher thermodynamic efficiency and lower-cost storage. Examples include the 110 MW Crescent Dunes plant in Nevada (though troubled) and newer projects in China and Morocco. Technology segmentation in CSP is shifting toward towers for utility-scale, while Linear Fresnel and Dish Stirling remain niche—the former for low-cost industrial heat, the latter for remote off-grid applications.
Capacity: Economies of Scale vs. Distributed Deployment
Plants above 100 MW capture economies of scale, with LCOEs dropping to around USD 0.10–0.15/kWh in high-DNI locations. Larger projects dominate the pipeline, especially in the Middle East and North Africa (MENA). Conversely, smaller units (<50 MW) serve distributed industrial heat needs or remote desalination facilities. This capacity split means CSP market forecast must account for both centralized power and decentralized thermal applications.
Operation: The Storage Edge
The defining operational choice is “with storage” versus “stand-alone.” CSP with molten salt storage can provide firm, dispatchable electricity for 6–15 hours, effectively competing with natural gas peaker plants. In grids where renewable penetration exceeds 40%, the value of dispatchability rises sharply. Stand-alone CSP plants (without storage) are cheaper but less flexible, and they face direct competition from PV. The storage segment is the true differentiator enabling CSP to provide firm capacity. This is why many new CSP projects in countries like Morocco (Noor complex) and China include 8–12 hours of storage.
[IMAGE: Cutaway diagram of a power tower with molten salt storage, showing heat transfer loops and turbine cycle.]
Beyond Electricity: CSP Applications in Enhanced Oil Recovery and Desalination
Enhanced Oil Recovery (EOR)
One of CSP’s most commercially viable non-power applications is enhanced oil recovery (EOR). Conventional EOR uses natural gas to generate steam for injection into oil reservoirs to reduce viscosity and increase extraction rates. CSP can replace gas-fired steam generation, offering a double benefit: reducing carbon emissions from oil production and freeing up natural gas for other uses. With global EOR demand estimated at 1.5 million barrels of steam per day, CSP’s addressable market in this sector alone is substantial.
Projects such as the Miraah plant in Oman (1 GW thermal) and GlassPoint’s operations in California have demonstrated technical feasibility. However, the sector has faced headwinds due to low oil prices and policy uncertainty. As carbon pricing rises and oil majors commit to lower emissions, CSP-enhanced oil recovery is re-emerging as a transitional solution.
Solar Thermal Desalination
Water scarcity in sunbelt regions makes CSP-driven desalination an attractive dual-use application. CSP plants can provide both electricity and thermal energy to desalination processes—particularly multi-effect distillation (MED) and thermal vapor compression (TVC). The waste heat from CSP’s power block can be used to drive desalination, improving overall plant efficiency. Combined CSP-desalination plants are being developed in Saudi Arabia, Australia, and Chile.
Cross-sector implications are significant: CSP integrates energy and water systems, offering resilience against water stress. This aligns with the United Nations Sustainable Development Goals and opens new revenue streams beyond electricity sales.
Supply Chain Dynamics and Policy Drivers
Supply Chain: Bottlenecks and Opportunities
CSP supply chains are more localized than PV. Key components—mirrors, receivers, heat transfer fluids (HTF), molten salt storage tanks, and steam turbines—are produced by a concentrated set of suppliers. For parabolic troughs, companies like Abengoa (Spain), Sener, and Flagsol dominate. Power tower components are even more specialized, with receiver technology largely held by a few firms (e.g., BrightSource Energy, heliostats from China). This concentration creates bottlenecks during boom cycles.
However, supply chain localization is emerging in regions like China and India, where domestic manufacturing is being incentivized. The global CSP supply chain is expected to diversify as demand from MENA and Asia grows.
Policy and Regulatory Landscape
CSP’s higher upfront costs mean policy support is crucial. Feed-in tariffs (FiTs) in Spain (since phased out) and Morocco’s Noor program have been key. China’s first batch of CSP demonstration projects (20 total, 1.35 GW) provided critical data on scaling. Recent policies in Chile, Australia, and South Africa include CSP-specific renewable energy auctions.
The most significant policy driver is the growing need for dispatchable renewable capacity. As grids reach PV saturation, system operators are implementing capacity payments and reliability contracts that reward firm supply. CSP’s storage capabilities position it well for these mechanisms. Carbon pricing also directly benefits CSP because its lifecycle emissions are near zero.
[IMAGE: Timeline of major CSP policy milestones from 2010 to 2025 across key countries, with annotations.]
Regional Market Dynamics: Where CSP Is Winning
Middle East and North Africa (MENA)
MENA is the strongest market for CSP due to high DNI, supportive policies, and large-scale project financing. Morocco’s Noor complex (580 MW) and Dubai’s DEWA 700 MW project (part of Mohammed bin Rashid Al Maktoum Solar Park) are flagships. Saudi Arabia’s NEOM project includes CSP for green hydrogen production. The region’s need for firm power to replace oil-fired generation makes CSP a preferred solution.
China
China has rapidly become the second-largest CSP market. After the 2018 demonstration program, the government included CSP in the 14th Five-Year Plan (2021–2025), targeting 3 GW by 2025. Projects in Gansu, Qinghai, and Xinjiang are integrating CSP with PV and wind in multi-source “clean energy bases.” China also leads in power tower technology, with the 200 MW Yumen project.
United States and Europe
The US CSP market is stagnant due to low gas prices and PV dominance. Existing plants like Ivanpah (392 MW) have faced operational challenges. However, California’s SB 100 (100% clean electricity by 2045) and federal tax credits for solar thermal with storage could revive interest, especially for hybrid PV-CSP plants.
Europe’s CSP growth is concentrated in Spain (2.3 GW installed) and recent projects in Greece and Cyprus. The EU’s REPowerEU plan and focus on industrial decarbonization may rekindle interest.
India and Australia
India’s Jawaharlal Nehru National Solar Mission included a CSP target, but high costs led to underperformance. However, new hybrid PPA structures (combining PV with CSP storage) are being explored. Australia’s concentrated solar thermal projects for mining and remote power are emerging, with the Aurora project (150 MW) in South Australia.
Future Outlook: CSP’s Role in the Long-Term Energy Mix
Technological Trends
Several innovations could reshape CSP’s cost trajectory: high-temperature receivers using supercritical CO2 Brayton cycles (targeting 700°C+), advanced particle-based storage, and heliostat cost reduction via additive manufacturing. These could bring CSP LCOE below USD 0.06/kWh by 2030, making it competitive with gas peakers.
Another promising trend is hybridization with PV—so-called “solar-plus-storage” where PV provides daytime cheap power and CSP displaces evening gas. Several projects in Chile (e.g., Cerro Dominador) already combine PV with CSP storage.
Cross-Sector Applications
Beyond power, CSP’s industrial heat potential is massive. Global industrial heat demand accounts for about 20% of total energy use, much of it for temperatures above 400°C. CSP can supply process heat for cement, steel, chemicals, and food processing. This is a nearly untapped market.
Green hydrogen production also requires high-temperature heat. CSP’s ability to provide consistent high-temp heat and electricity could make it a cornerstone of future hydrogen hubs in sunbelt regions.
Conclusion: The Hidden Linchpin
CSP will never rival solar PV in installed capacity. But its strategic importance grows with each percentage point of renewable penetration. The ability to store thermal energy cheaply and dispatch power on demand makes CSP a critical complement to variable renewables. Its cross-sector reach into EOR, desalination, and industrial heat means CSP’s impact extends beyond electricity markets into water, oil, and industrial decarbonization.
The renewable energy boom is not a monolithic story. Within the broader trajectory, concentrated solar power occupies a niche—but a powerful, indispensable one. For investors, grid planners, and policymakers, understanding CSP’s unique value proposition is essential for building an energy system that is not only clean but resilient.
[IMAGE: Infographic summarizing key takeaways: CSP CAGR 11.1%, storage hours, applications (EOR, desalination, industrial heat), and regional leaders.]
---
Note on Sources: The market size and CAGR figures cited in this article are drawn from industry reports by the International Renewable Energy Agency (IRENA), BloombergNEF, and the Solar Energy Industries Association (SEIA). Specific project data and policy references are based on publicly available information from the National Renewable Energy Laboratory (NREL), the International Energy Agency (IEA) SolarPACES program, and government announcements from Morocco, China, and the UAE. For precise sourcing details, readers should consult the original publications from these organizations. This article is intended as an analytical synthesis and does not substitute for official market reports.
Keywords

Omar Hassan
Energy Correspondent tracking OPEC+ policies and renewable energy transitions.