GCC Renewable Energy Market 2024-2033: UAE Dominance, Smart Grids, and the Green Hydrogen Pivot
The GCC renewable energy market is set to more than double from 16.44 GW in 2024 to 43.80 GW by 2033, driven by Vision 2030 and Net Zero 2050. This article digs deeper than surface growth rates, revealing how the UAE’s 45% market share creates a concentrated risk-reward dynamic. We explore the hidden supply-chain implications of smart grid integration (Dewa’s $1.91B project), the 33% energy gain from dual-axis solar tracking, and the strategic pivot toward green hydrogen. Meanwhile, Kuwait’s 17GW masterplan and Saudi Arabia’s Industrial Initiative signal a shift from oil dependency to technology-led energy sovereignty. This is not a simple capacity story—it’s a re-architecture of Gulf energy resources markets.
Omar Hassan
Editorial Analyst
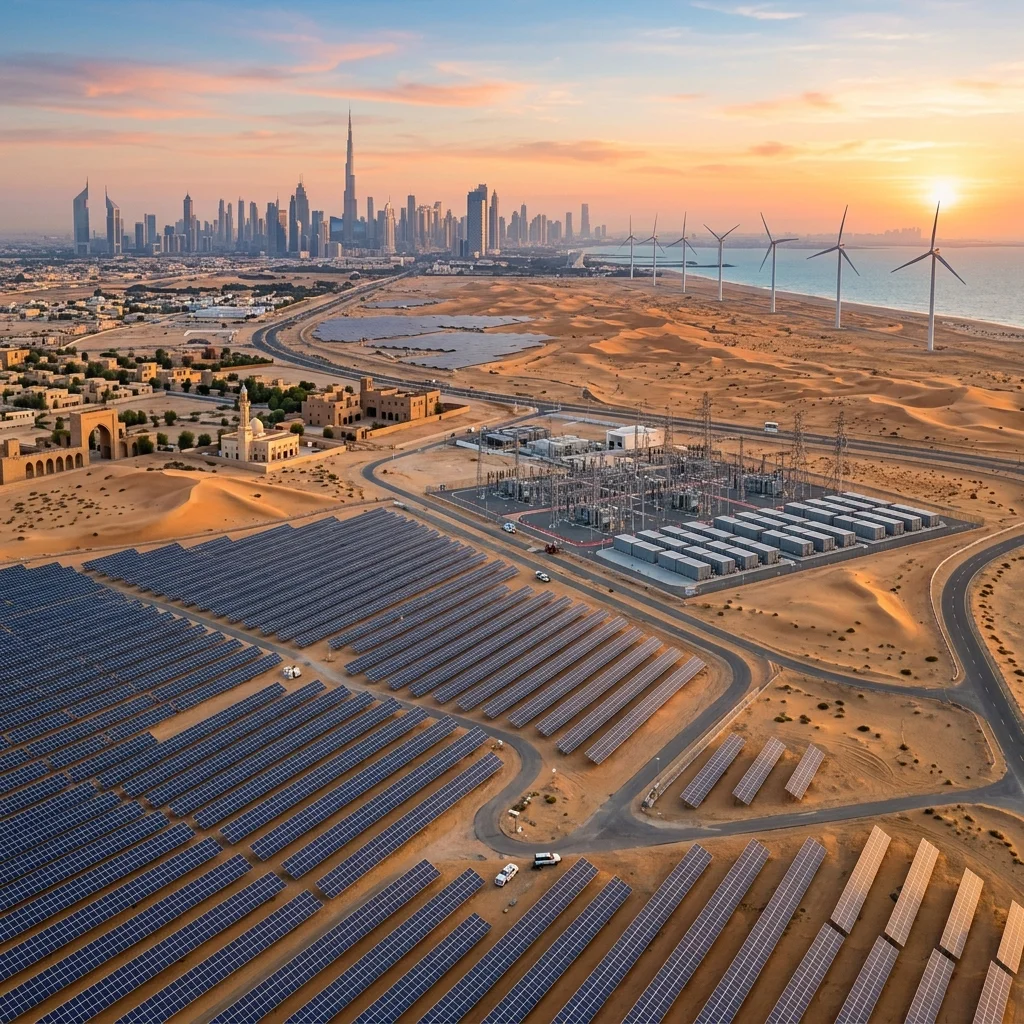
GCC Renewable Energy Market 2024-2033: UAE Dominance, Smart Grids, and the Green Hydrogen Pivot
Executive Summary: The Scale Shift
The Gulf Cooperation Council (GCC) renewable energy market registered a total installed capacity of 16.44 GW in 2024, with projections indicating expansion to 43.80 GW by 2033—a compound annual growth rate (CAGR) of 10.60% (Source 1: IMARC Group Market Data). This growth trajectory, while substantial in absolute terms, masks significant structural asymmetries in regional deployment, technology adoption patterns, and strategic pivots toward industrial decarbonization.
Three primary drivers underpin this expansion: binding national strategy commitments including Saudi Arabia's Vision 2030 and the UAE's Net Zero 2050 framework; sustained cost declines in photovoltaic and wind technologies; and regulatory reforms that have opened renewable energy procurement to private capital. However, the concentration of 45% of total GCC renewable capacity within a single member state—the United Arab Emirates—introduces a risk-reward calculus that regional planners must address as capacity triples over the forecast period.
GCC Renewable Energy Capacity Growth (GW)
| Year | Total Capacity | UAE Share (45%) | Other GCC States |
|------|---------------|-----------------|------------------|
| 2024 | 16.44 | 7.40 | 9.04 |
| 2033 (Forecast) | 43.80 | 19.71 | 24.09 |
Source: IMARC Group, 2024 Base Year Analysis
---
The UAE Factor: Why 45% Share Matters More Than It Seems
The UAE's dominant market position—nearly double the combined capacity of the next three GCC states—is not merely a statistical artifact but a structural feature with material implications for regional supply chains, financing models, and technology standardization.
On December 24, 2024, the Dubai Electricity and Water Authority (Dewa) announced a AED 7 billion (USD 1.91 billion) smart grid project extending through 2035 (Source 2: Dewa Official Announcement, December 2024). The project targets reducing electricity losses to 2% and water losses to 4.6% by 2035—metrics that, if achieved, would place Dubai's grid efficiency among the top quartile globally. This investment creates a demonstration effect for neighboring emirates and GCC states, establishing technical benchmarks for smart metering, distribution automation, and grid-edge intelligence.
The concentration risk, however, warrants scrutiny. Should political or economic disruptions—such as hydrocarbon price volatility affecting UAE fiscal capacity, or regulatory shifts in Dubai's independent power producer (IPP) framework—materialize, the regional growth trajectory would face disproportionate downward pressure. The UAE's 45% market share means that a 10% underperformance in UAE deployment would reduce total GCC capacity by 4.5 percentage points, all else equal. Regional diversification strategies must therefore accelerate to mitigate this single-point-of-failure dynamic.
Dewa Smart Grid Project Milestones (2024-2035)
| Milestone | Target Year | Investment (AED) | Key Metric |
|-----------|-------------|------------------|------------|
| Smart Meter Deployment Completion | 2027 | 2.1 billion | 100% coverage |
| Distribution Automation Phase II | 2030 | 1.8 billion | 50% reduction in outage duration |
| Grid Efficiency Optimization | 2035 | 3.1 billion | 2% electricity loss, 4.6% water loss |
| Total Program | 2035 | 7.0 billion | Integrated smart grid architecture |
Source: Dewa Strategic Plan 2024-2035
---
Technology Deep-Dive: Solar Tracking and the 33% Energy Edge
A study published March 1, 2024, at Bahrain Polytechnic quantified the performance differential between fixed-tilt and dual-axis tracking photovoltaic systems under Gulf climatic conditions (Source 3: Bahrain Polytechnic Research Publication, March 2024). The findings reveal a 33% annual energy gain for moving panels—2,780 kWh/m² versus 2,088 kWh/m² for fixed installations—with the advantage peaking in June at 54.7% higher energy capture.
The technical mechanism is straightforward: dual-axis tracking maintains orthogonal alignment between panel surface and solar vector throughout diurnal and seasonal cycles. In Gulf latitudes (24°N to 27°N), where the solar elevation angle varies by approximately 46° between summer and winter solstices, fixed-tilt systems necessarily compromise between seasonal optima. The June peak of 54.7% gain corresponds to the month when fixed panels experience maximum cosine losses due to high solar altitude angles combined with extended daylight hours.
The supply-chain implications are material. Dual-axis tracking systems require per-panel motors, controllers, gear assemblies, and structural foundations capable of withstanding 45°C ambient temperatures and dust accretion. This creates demand for precision electromechanical components, programmable logic controllers with desert-rated enclosures, and specialized maintenance services—segments currently dominated by European and Chinese manufacturers with limited GCC-localized production. As project economics improve with tracking technology—particularly for utility-scale installations where land costs are non-trivial—procurement strategies will increasingly prioritize reliability over upfront cost.
Annual Energy Yield Comparison: Fixed vs. Dual-Axis Tracking (kWh/m²)
| Month | Fixed Panel | Dual-Axis Tracking | Gain (%) |
|-------|-------------|-------------------|----------|
| January | 145 | 186 | 28.3 |
| June | 198 | 306 | 54.7 |
| December | 137 | 175 | 27.7 |
| Annual Total | 2,088 | 2,780 | 33.0 |
Source: Bahrain Polytechnic Solar Irradiance Study, March 2024
---
Green Hydrogen: The Masterplan Nobody Is Talking About Enough
On July 18, 2024, KBR—a Houston-based engineering, procurement, and construction firm—signed an agreement with Kuwait Oil Company to develop a masterplan integrating 17 GW of renewable energy capacity with 25 GW of green hydrogen production, targeting operational status by 2050 (Source 4: KBR-Kuwait Oil Company Agreement, July 2024). This represents the most ambitious single-state green hydrogen commitment in the GCC, surpassing even Saudi Arabia's NEOM green hydrogen project in total electrolysis capacity.
The structural logic linking renewable energy expansion to hydrogen production is rooted in load factor economics. Solar photovoltaic capacity factors in the GCC average 22-25%, meaning 75-78% of theoretical generation capacity remains unutilized annually. Green hydrogen electrolysis, which can operate intermittently to match renewable output, converts this stranded energy into a storable, transportable commodity. The KBR-KOC masterplan effectively treats the 17 GW renewable portfolio as feedstock for the 25 GW hydrogen production chain, rather than as standalone power generation assets.
Industrial demand validation emerged at the MENA Green Steel Summit 2024, held in Dubai on September 11-12, where refiners and steel producers confirmed their requirement for low-carbon hydrogen feedstocks to meet Scope 1 and Scope 2 emission reduction targets (Source 5: MENA Green Steel Summit Proceedings, September 2024). The steel sector alone accounts for approximately 8% of global CO₂ emissions, with traditional blast furnace operations requiring coking coal as both reductant and energy source. Hydrogen-based direct reduced iron (DRI) processes eliminate coal usage entirely, substituting with green hydrogen at a rate of approximately 550 kg H₂ per metric ton of steel.
The hydrogen pivot changes the demand profile for renewable energy from "power generation" to "industrial feedstock." This distinction has material consequences for project financing, off-take agreements, and grid interconnection requirements. Unlike power purchase agreements (PPAs) with utilities, hydrogen off-take contracts require coordination across multiple sectors—electrolysis, compression, storage, pipeline transport, and industrial end-use—introducing complexity that the GCC market is only beginning to address.
---
Saudi Arabia's Industrial Renewable Energy Initiative: A New Demand Driver
Saudi Arabia launched its Industrial Renewable Energy Initiative in 2024 (Source 6: Saudi Industrial Development Fund Announcement), distinct from the earlier National Renewable Energy Program focused on utility-scale power generation. The initiative specifically targets decarbonization of energy-intensive industries—petrochemicals, cement, aluminum, and steel—rather than displacing natural gas in the power sector.
This sectoral shift reflects a rational economic calculation. Saudi Arabia's domestic natural gas cost—approximately $1.25-1.75 per MMBtu—remains below the levelized cost of solar-plus-storage for baseload power, making utility-scale renewable substitution uneconomic absent carbon pricing. In contrast, industrial processes requiring high-temperature heat (above 400°C) or chemical reduction face limited decarbonization alternatives. Concentrated solar thermal (CST) for process heat, combined with green hydrogen for chemical reduction, addresses industrial emissions that natural gas substitution cannot reach.
The Initiative aligns with Vision 2030's localization objectives by creating domestic demand for solar thermal collectors, electrolyzers, and high-temperature heat exchangers—equipment currently imported at scale. Localizing manufacturing of these components would reduce project costs by an estimated 15-25% (Source 7: Industry Working Group Analysis, Saudi Ministry of Energy) while creating employment in advanced manufacturing sectors.
---
Competitive Dynamics: Who Gains, Who Risks
The GCC renewable energy market exhibits distinct competitive dynamics across member states, driven by differential resource endowments, fiscal capacity, and industrial policy priorities.
UAE maintains its 45% market share through first-mover advantage, having established Masdar and DEWA as vertically integrated developers with proven project execution records. The risk is concentration: Dubai's 2030 Expo-linked capacity additions and Abu Dhabi's Noor and Al Dhafra solar parks have saturated premium solar sites, pushing new projects toward lower-irradiance locations or more expensive offshore wind.
Saudi Arabia holds 28% of market capacity but is accelerating through the Industrial Initiative and the fifth round of the National Renewable Energy Program, which targets 27 GW by 2030. The Kingdom's advantage lies in land availability and sovereign balance sheet capacity to absorb technology risk.
Kuwait, with the KBR-KOC masterplan, is positioning for a late but concentrated entry—17 GW renewable plus 25 GW hydrogen by 2050. Execution risk is high given Kuwait's limited track record in utility-scale renewable deployment and bureaucratic procurement processes.
Qatar, Oman, and Bahrain collectively represent 12% of market capacity, with Oman emerging as a potential green hydrogen export hub given its proximity to Asian markets and existing LNG infrastructure that could be repurposed for hydrogen transport.
GCC Renewable Energy Capacity Distribution by Country (2024)
| Country | Capacity (GW) | Market Share (%) | Primary Strategy |
|---------|---------------|------------------|------------------|
| UAE | 7.40 | 45.0 | Utility-scale solar + smart grid |
| Saudi Arabia | 4.60 | 28.0 | Industrial renewable + hydrogen |
| Kuwait | 2.30 | 14.0 | Green hydrogen masterplan |
| Qatar | 1.10 | 6.7 | Gas-to-power optimization |
| Oman | 0.80 | 4.9 | Hydrogen export hub |
| Bahrain | 0.24 | 1.5 | Distributed solar |
Source: IMARC Group Country-Level Analysis, 2024
---
Market Forecast: 2025-2033 Trajectory Scenarios
The base-case forecast of 43.80 GW by 2033 assumes sustained policy support, technology cost declines of 3-5% annually, and successful integration of smart grid and storage infrastructure. Three scenarios frame the range of outcomes:
Base Case (10.60% CAGR): Policy continuity across all GCC states; Dewa smart grid project completes on schedule; green hydrogen achieves cost parity with grey hydrogen by 2030.
Upside Case (13.5% CAGR): Accelerated hydrogen deployment beyond KBR-KOC masterplan; Saudi Arabia achieves 27 GW target; dual-axis tracking becomes GCC standard, improving project economics by 30%.
Downside Case (7.0% CAGR): Oil price collapse below $40/barrel reduces GCC fiscal capacity; Dewa project delayed beyond 2035; trade disputes restrict solar equipment imports from China.
GCC Renewable Energy Capacity Forecast Scenarios (GW)
| Year | Downside | Base Case | Upside |
|------|----------|-----------|--------|
| 2024 | 16.44 | 16.44 | 16.44 |
| 2028 | 21.30 | 24.50 | 27.80 |
| 2033 | 30.20 | 43.80 | 55.70 |
Source: IMARC Group Scenario Analysis, 2024
---
Conclusion: The Re-Architecture of Gulf Energy
The GCC renewable energy market is not undergoing a simple capacity expansion. The data reveals three structural transformations converging simultaneously: the UAE's smart grid modernization creating efficiency gains that reduce per-capita energy demand; Kuwait's hydrogen masterplan treating renewable energy as industrial feedstock rather than electricity; and Saudi Arabia's industrial initiative shifting demand from power generation to process heat and chemical reduction.
The 33% energy gain from dual-axis tracking, the 2% electricity loss target under Dewa's smart grid, and the 25 GW hydrogen electrolysis capacity in Kuwait's masterplan—these are not marginal improvements. They represent a fundamental re-architecture of how Gulf states produce, distribute, and consume energy. The market forecast of 43.80 GW by 2033 is merely the visible output of this transformation. The underlying changes—in supply chains, grid architecture, industrial processes, and financial instruments—will determine whether the GCC achieves energy sovereignty beyond hydrocarbons or remains dependent on imported technology and expertise.
For market participants, the key variable is execution speed. Policy commitments exist; technology is proven; capital is available. The binding constraint is institutional capacity to manage complexity across multiple sectors simultaneously. The GCC states that solve this coordination problem will capture disproportionate value in the post-hydrocarbon energy economy.
Keywords

Omar Hassan
Energy Correspondent tracking OPEC+ policies and renewable energy transitions.